You compare two capsule filling machines. Machine A runs faster, but takes longer to clean between products. Machine B has lower top speed, but changes over in half the time. Which one actually costs less per good batch?
Most buyers focus on runtime cost—hours of actual filling multiplied by labor and overhead. Yet for many production environments, especially those with frequent product changes, changeover and cleaning time often account for 40–60% of total batch cycle time. Ignoring these non-productive periods leads to equipment decisions that look good on paper but underperform on the factory floor.
This article provides a practical method to calculate true batch cost, including all downtime between batches. You will learn how to measure changeover and cleaning time, assign accurate costs, and compare equipment architectures based on total cost per good batch—not just runtime speed.
Traditional batch costing typically includes:
Direct labor during filling
Machine runtime energy
Raw material cost
Quality control sampling
But it often excludes or undercounts:
Time to clean the machine after batch completion
Time to change molds and reconfigure for the next product
Material lost during changeover (rejected capsules)
Labor during changeover and cleaning (often 1–2 operators, same hourly rate as runtime)
Lost production opportunity (machine not available for other batches)
According to industry benchmarks from the International Society for Pharmaceutical Engineering (ISPE), changeover and cleaning can represent 20–50% of total equipment time in multi-product solid dosage facilities. For small-batch, high-mix operations, the proportion often exceeds 50%.
The core insight: A machine with 30% lower runtime cost but 100% longer changeover may be more expensive per batch for short runs.
Use this step-by-step framework to compare any two machines or production scenarios. Download and fill the template (you can recreate it in a spreadsheet).
Calculate theoretical runtime based on machine rated speed, then adjust for real-world efficiency.
Formula:Runtime (hours) = Batch size (capsules) ÷ (Rated speed × Efficiency factor)
Efficiency factor accounts for stoppages, minor adjustments, and speed loss for difficult materials:
New machine, easy material: 0.85–0.90
Average conditions: 0.75–0.80
Challenging powder, frequent jams: 0.60–0.70
Example: 150,000 capsule batch on a machine rated at 100,000 capsules/hour with 0.80 efficiency:
Runtime = 150,000 ÷ (100,000 × 0.80) = 150,000 ÷ 80,000 = 1.875 hours
Changeover time includes all activities from the last good capsule of product A to the first good capsule of product B:
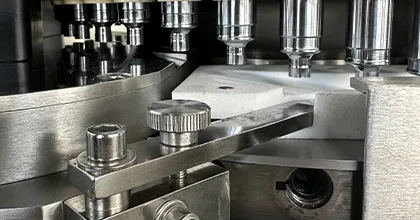
Removing previous molds, dosing pins, and retention fingers
Cleaning machine surfaces (powder removal, vacuuming)
Installing molds and tooling for next capsule size
Calibrating pin depth and alignment
Test run and weight verification (discard reject capsules)
Typical ranges by machine architecture (based on industry surveys, not brand-specific):
| Machine Type | Changeover Time (same capsule size) | Changeover Time (different size) |
| Single-station, quick-change molds | 15–30 min | 30–45 min |
| Single-station, standard change | 30–60 min | 60–90 min |
| Double-station, quick-change | 40–60 min | 70–120 min |
| Double-station, standard | 60–90 min | 120–180 min |
The Parenteral Drug Association (PDA) Technical Report No. 60 on “Process Validation” emphasizes that changeover time should be treated as a critical process parameter in multi-product facilities, with documented time studies required for regulatory compliance.
Cleaning time is often separate from changeover when switching between products with different active ingredients or colors. Full cleaning includes:
Disassembly of product-contact parts
Manual or automated washing (water, solvent, or dry wipe)
Drying (air or heat)
Reassembly and visual inspection
Line clearance documentation
Typical cleaning time ranges:
Same product family, no color change: 15–30 min
Different active (low risk): 45–90 min
Different active (high potency): 120–240 min (may require wash-in-place cycle)
Critical note: Many buyers entirely overlook cleaning time when comparing automatic capsule filling machine specifications. A fast capsule filling machine that is difficult to disassemble and clean may add hours of downtime for every batch change.
Material loss includes:
Powder or pellets remaining in hopper that cannot be recovered (often 0.5–2 kg)
Capsules rejected during test runs (typically 100–500 capsules)
Product left in dosing system (difficult to reclaim)
Example calculation:
Hopper dead volume: 1.5 kg powder × $50/kg = $75
Rejected capsules: 200 capsules × $0.05 material cost each = $10
Total material loss per changeover: $85
For expensive APIs or nutraceutical ingredients, material loss alone can exceed labor cost of changeover.
Sum all cost components:
| Cost Component | Calculation |
| Runtime labor | Runtime (hours) × Operator hourly rate × Number of operators |
| Runtime overhead | Runtime (hours) × Machine hourly overhead (depreciation, maintenance, floor space) |
| Changeover labor | Changeover time (hours) × Operator rate × Operators |
| Cleaning labor | Cleaning time (hours) × Operator rate × Operators |
| Material loss | Cost of powder + capsules rejected during changeover |
| Opportunity cost (optional) | Lost production time × gross profit per hour of alternative work |
Total true batch cost = Sum of all above
Example comparison (150,000 capsule batch):
| Cost Element | Machine X (fast runtime, slow changeover) | Machine Y (moderate runtime, fast changeover) |
| Runtime (hours) | 1.5 | 2.0 |
| Runtime labor + overhead (@ $150/hr) | $225 | $300 |
| Changeover + cleaning time (hours) | 2.5 | 1.0 |
| Changeover labor (@ $100/hr) | $250 | $100 |
| Material loss | $120 | $60 |
| True batch cost | $595 | $460 |
Machine Y, despite slower runtime, costs 23% less per batch due to faster changeover and lower material loss.
Rated speed (e.g., “150,000 capsules/hour”) is measured under ideal conditions with perfect powder and a skilled operator. Real-world achieved speed is often 15–30% lower. Always apply an efficiency factor.
Many buyers assume changeover and cleaning are the same activity. For regulated industries (pharmaceuticals, nutraceuticals), cleaning between different actives requires validated procedures that take significantly longer than a simple mold change.
Powder left in hoppers, dosing discs, and transfer chutes represents real cost. For high-value ingredients, material loss per changeover can exceed labor cost. Ask equipment suppliers about “hopper dead volume” and “dosing system recoverable volume.”
If you run 90% of batches at 50,000 capsules and 10% at 500,000 capsules, the average batch size (95,000) misrepresents cost. Calculate true batch cost separately for each typical batch size and weight by frequency.
A 2023 operational efficiency study published in the Journal of Pharmaceutical Innovation (Vol. 18, Issue 3) found that “facilities using batch-size-weighted costing rather than simple averages reduced equipment selection errors by approximately 35%.”
Profile: High mix, small to medium batches, frequent product changes.
Cost driver: Changeover and cleaning time (accounts for 50–60% of total batch cycle time).
Calculation result: A machine with 30% lower runtime speed but 50% faster changeover delivers 25–35% lower true batch cost.
Decision implication: Prioritize fast changeover and easy cleaning over maximum speed.
Profile: Low mix, large batches, infrequent changes.
Cost driver: Runtime speed and uptime (changeover time amortized over many capsules).
Calculation result: A machine with 15% faster runtime but 100% longer changeover still has lower total cost because changeover cost per capsule is small.
Decision implication: Prioritize runtime speed and reliability over changeover speed.
For a structured decision framework matching machine architecture to your batch size distribution, see the solutions overview for pharmaceutical manufacturing →.
Follow this process during equipment evaluation:
Collect your own data – For 10 recent batches, measure actual runtime, changeover time, cleaning time, and material loss. Do not rely on supplier estimates for your products.
Request changeover demonstration – Ask suppliers to perform a full changeover (including cleaning) during a site visit or video call. Time it yourself.
Calculate cost for your batch size distribution – Run the calculation for small, medium, and large batches separately. Weight by frequency.
Compare on total cost, not speed – The machine with the lowest true batch cost for your most frequent batch size is usually the correct choice.
You now have a method to calculate true batch cost that includes changeover and cleaning time—the two most commonly overlooked cost drivers in multi-product environments.
The key takeaways:
For batch sizes under 200,000 capsules with frequent changeovers, changeover and cleaning time often dominate total cost.
Measure real-world runtime, changeover, and cleaning time for your actual products, not supplier literature.
Use true batch cost (not runtime speed) as the primary comparison metric.
Once you have calculated true batch cost for your production profile, comparing specific machine specifications becomes straightforward. Evaluate architectures based on how their changeover systems and cleanability affect your true batch cost, not just their maximum speed ratings.
How to validate fill weight accuracy during capsule machine commissioning
Changeover time reduction strategies for intermittent rotary capsule fillers
Cleaning validation for multi-product capsule filling lines
Calculating total cost of ownership (TCO) for capsule filling equipment: beyond batch cost
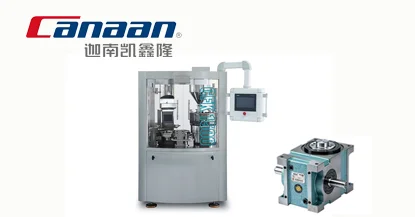

No. of station:26/32/40
Max.tablet diameter:25/16/13mm
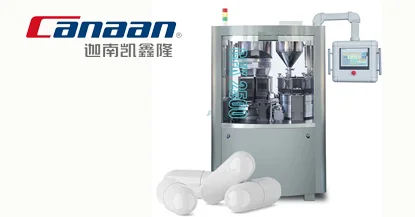
No. of station:45/55/75
Max.tablet diameter:25/16/13mm
24/7 Online Technical Support
One-Year Warranty and Spare Parts Coverage
Lifetime free technical consulting service
GET A QUOTE